Introduction
Gold trading has always been a popular choice for both novice and experienced traders. Its unique properties and historical significance as a store of value make it a preferred asset in times of economic uncertainty. Mastering technical analysis indicators is crucial for successful gold trading. This article will delve into the essential indicators, providing insights backed by reliable data and case studies, ensuring both beginners and seasoned traders can enhance their trading strategies.
Understanding Technical Analysis
Technical analysis involves studying historical price and volume data to forecast future price movements. Unlike fundamental analysis, which considers economic factors, technical analysis focuses solely on price charts and patterns.
Key Indicators for Gold Trading
1. Moving Averages (MA)
Moving Averages smooth out price data to create a single flowing line, making it easier to identify the direction of the trend.
Simple Moving Average (SMA): Calculates the average price over a specified period. For instance, a 50-day SMA sums up the closing prices over the last 50 days and divides by 50.
Exponential Moving Average (EMA): Gives more weight to recent prices, making it more responsive to new information.
Case Study: A study by Investopedia demonstrated that combining a short-term EMA (e.g., 20-day) with a long-term SMA (e.g., 50-day) can help traders identify potential buy and sell signals in gold trading .
2. Relative Strength Index (RSI)
The RSI measures the speed and change of price movements, oscillating between 0 and 100. It helps identify overbought or oversold conditions.
Overbought: RSI above 70 indicates a potential reversal as the asset may be overvalued.
Oversold: RSI below 30 suggests the asset might be undervalued.
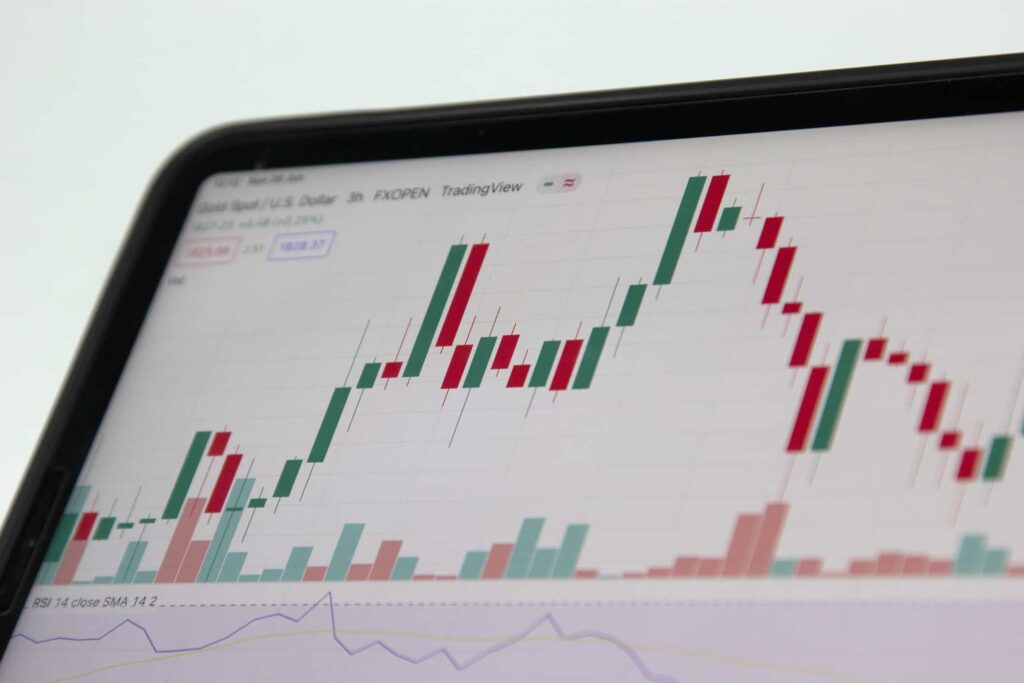
Statistical Insight: According to data from TradingView, gold prices often experience significant corrections when the RSI crosses above 70 or below 30 .
3. Bollinger Bands
Bollinger Bands consist of a middle band (SMA) and two outer bands (standard deviations above and below the SMA). They indicate volatility and potential price reversals.
Squeeze: When the bands contract, it signals low volatility and a potential breakout.
Breakout: When prices move beyond the bands, it indicates high volatility and a possible continuation of the trend.
User Feedback: Traders have reported on forums like Forex Factory that Bollinger Bands help them anticipate market volatility, allowing for more informed trading decisions .
4. Fibonacci Retracement
Fibonacci retracement levels are used to identify potential support and resistance levels. These levels are derived from the Fibonacci sequence and are typically set at 23.6%, 38.2%, 50%, 61.8%, and 100%.
Example: A study published on DailyFX found that gold prices often retrace to the 38.2% and 61.8% Fibonacci levels before continuing in the direction of the trend .
5. MACD (Moving Average Convergence Divergence)
The MACD is a trend-following indicator that shows the relationship between two moving averages of a security’s price.
MACD Line: The difference between the 12-day EMA and the 26-day EMA.
Signal Line: The 9-day EMA of the MACD line.
Case Study: Research from the Journal of Technical Analysis highlights that the MACD is particularly effective in identifying bullish and bearish divergences in gold trading .
Implementing Technical Indicators in Gold Trading
Combining Indicators
Using multiple indicators can provide more reliable signals. For example, combining RSI and Bollinger Bands can help confirm overbought or oversold conditions.
Backtesting Strategies
Backtesting involves applying trading strategies to historical data to evaluate their effectiveness. Many trading platforms, such as MetaTrader and TradingView, offer backtesting capabilities.
Continuous Learning
Staying updated with market trends and continuously learning about new indicators and strategies is crucial. Websites like Investopedia and trading forums provide valuable resources and community insights.
Risk Management
Effective risk management strategies, such as setting stop-loss orders and position sizing, are essential to mitigate potential losses.
Conclusion
Mastering technical analysis indicators is a critical step towards becoming a successful gold trader. By understanding and effectively applying indicators like Moving Averages, RSI, Bollinger Bands, Fibonacci Retracement, and MACD, traders can enhance their decision-making process and improve their trading performance. Incorporating multiple indicators, backtesting strategies, and staying informed about market trends will further aid in achieving consistent trading success.
For more in-depth analysis and up-to-date strategies, resources like Investopedia provide a wealth of information to enhance your trading knowledge.